Implementing the PSA
Discover what it takes to implement the PSA effectively and responsibly.
Arizona, Kentucky, New Jersey, and Utah implemented the PSA statewide. Many counties and cities throughout the country also use the PSA. Refer to the list below for details on where the PSA is used. If your jurisdiction has implemented the PSA, and it is not listed below, please contact us to be added.
Contact Us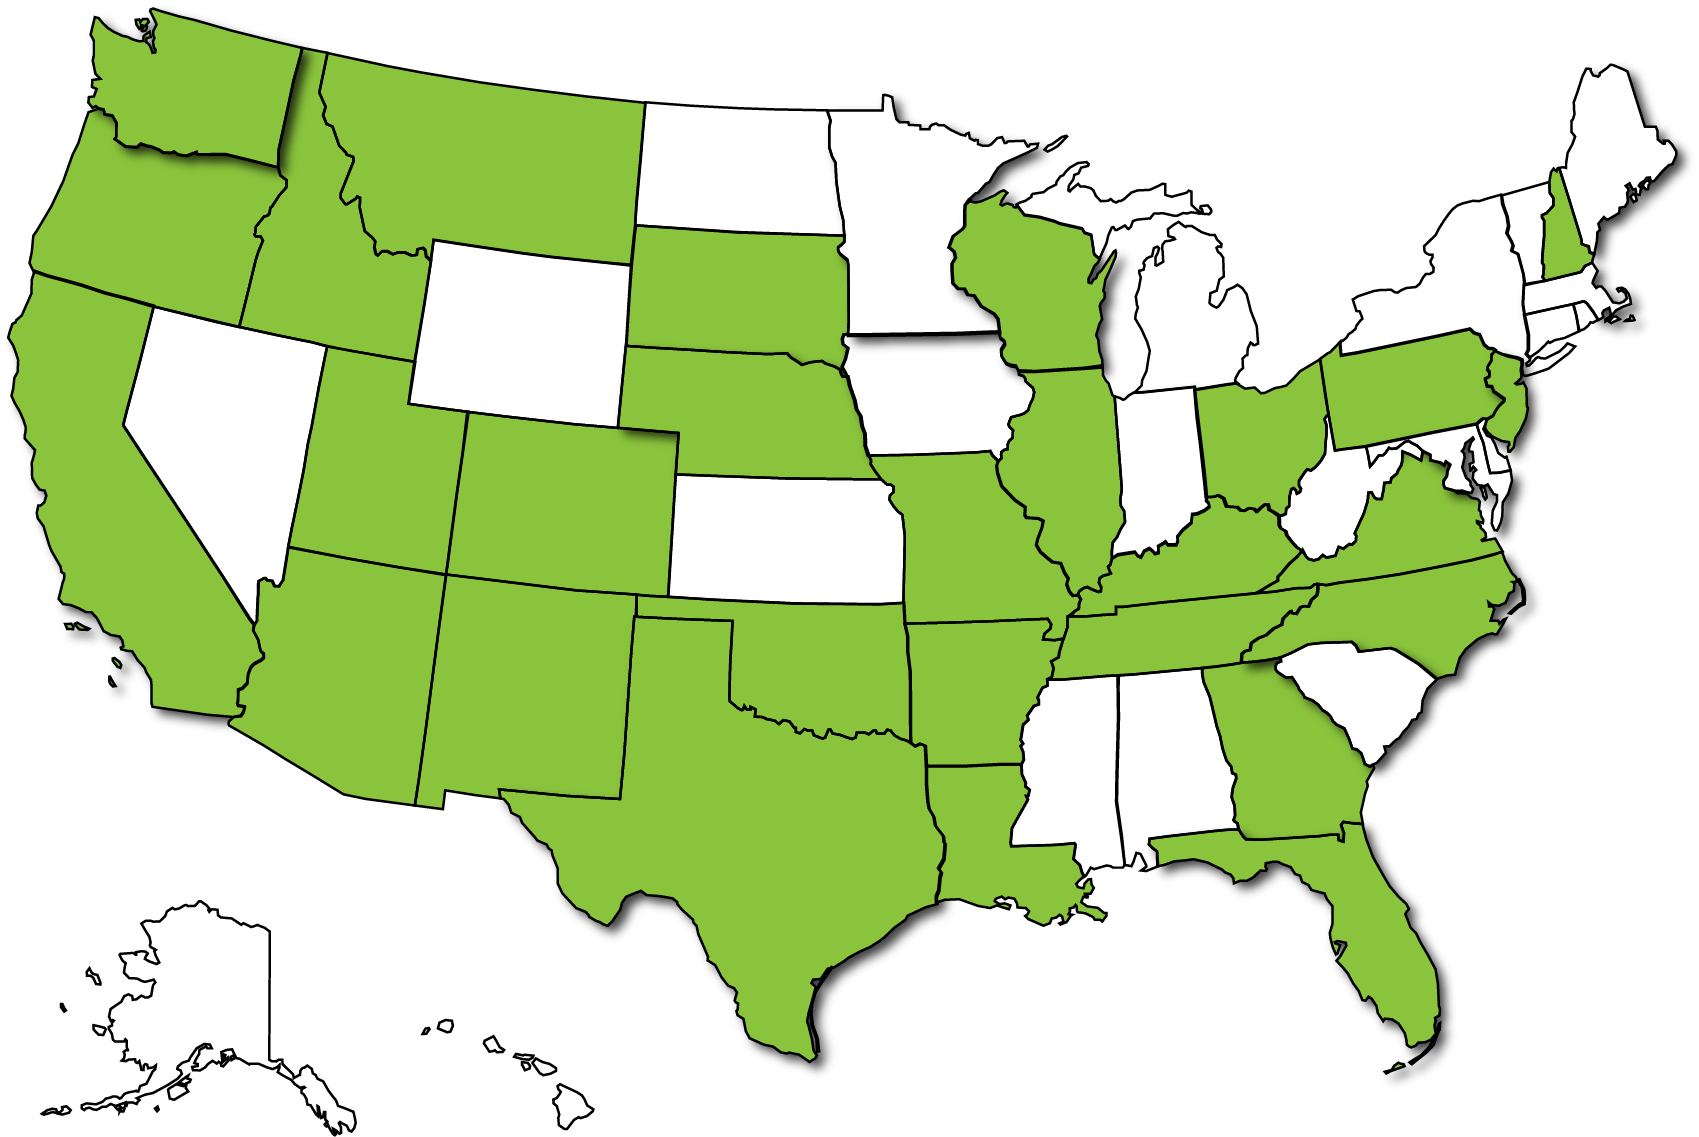
| Location | Population | Year |
|---|---|---|
| State of Arizona | 7,000,000 | 2017 |
| Location | Population | Year |
|---|---|---|
| Pulaski County | 399,145 | 2024 |
| Location | Population | Year |
|---|---|---|
| Alameda County | 1,649,000 | 2022 |
| Butte County | 208,334 | 2024 |
| Calaveras County | 45,602 | 2020 |
| Colusa County | 21,839 | 2022 |
| Contra Costa County | 1,154,000 | 2020 |
| Del Norte County | 27,812 | 2020 |
| El Dorado County | 192,823 | 2026 |
| Fresno County | 999,101 | 2021 |
| Glenn County | 28,304 | 2021 |
| Inyo County | 18,485 | 2025 |
| Kern County | 917,673 | 2023 |
| Kings County | 154,913 | 2024 |
| Lake County | 67,764 | 2024 |
| Los Angeles County | 10,040,000 | 2020 |
| Marin County | 256,400 | 2024 |
| Mariposa County | 17,147 | 2022 |
| Mendocino County | 91,305 | 2022 |
| Merced County | 286,461 | 2022 |
| Mono County | 12,991 | 2024 |
| Monterey County | 437,325 | 2022 |
| Nevada County | 103,487 | 2022 |
| Riverside County | 2,471,000 | 2020 |
| Sacramento County | 1,552,000 | 2020 |
| San Benito County | 64,209 | 2021 |
| San Bernardino County | 2,214,281 | 2021 |
| San Francisco (City) | 884,000 | 2016 |
| San Luis Obispo County | 281,843 | 2021 |
| Santa Clara County | 1,928,000 | 2021 |
| Santa Cruz County | 274,000 | 2014 |
| Sierra County | 3,236 | 2022 |
| Sonoma County | 494,336 | 2020 |
| Stanislaus County | 552,999 | 2020 |
| Sutter County | 96,971 | 2020 |
| Trinity County | 16,112 | 2021 |
| Tulare County | 464,493 | 2018 |
| Tuolumne County | 54,478 | 2020 |
| Ventura County | 832,605 | 2024 |
| Location | Population | Year |
|---|---|---|
| Douglas County | 368,990 | 2022 |
| Elbert County | 27,128 | 2023 |
| Lincoln County | 5,688 | 2023 |
| Location | Population | Year |
|---|---|---|
| Volusia County | 539,000 | 2016 |
| Location | Population | Year |
|---|---|---|
| Fulton County | 1,065,000 | 2022 |
| Location | Population | Year |
|---|---|---|
| Bannock County | 88,263 | 2023 |
| Boonesville County | 133,644 | 2024 |
| Location | Population | Year |
|---|---|---|
| Cook County | 5,200,000 | 2015 |
| Kane County | 535,000 | 2016 |
| Lake County | 696,535 | 2021 |
| McLean County | 172,000 | 2016 |
| Location | Population | Year |
|---|---|---|
| State of Kentucky | 4,500,000 | 2013 |
| Location | Population | Year |
|---|---|---|
| Orleans Parish | 393,000 | 2018 |
| Location | Population | Year |
|---|---|---|
| Audrain County | 24,982 | 2023 |
| Boone County | 192,154 | 2025 |
| Greene County | 293,086 | 2020 |
| Mississippi County | 12,538 | 2024 |
| Montgomery County | 11,415 | 2023 |
| St. Louis County | 998,692 | 2019 |
| Scott County | 37,840 | 2023 |
| Warren County | 37,260 | 2024 |
| Location | Population | Year |
|---|---|---|
| Butte-Silver Bow County | 34,993 | 2018 |
| Cascade County | 81,366 | 2020 |
| Flathead County | 103,806 | 2019 |
| Lake County | 30,250 | 2018 |
| Lewis and Clark County | 69,432 | 2018 |
| Missoula County | 119,600 | 2018 |
| Ravalli County | 45,959 | 2022 |
| Yellowstone County | 161,300 | 2018 |
| Location | Population | Year |
|---|---|---|
| Douglas County | 585,008 | 2022 |
| Location | Population | Year |
|---|---|---|
| Strafford County | 134,202 | 2024 |
| Location | Population | Year |
|---|---|---|
| State of New Jersey | 9,000,000 | 2017 |
| Location | Population | Year |
|---|---|---|
| Bernalillo County | 679,121 | 2017 |
| Catron County | 3,579 | 2025 |
| Cibola County | 27,184 | 2023 |
| Colfax County | 12,387 | 2025 |
| Curry County | 48,430 | 2025 |
| Debaca County | 1,698 | 2025 |
| Dona Ana County | 218,195 | 2021 |
| Grant County | 26,998 | 2021 |
| Guadalupe County | 4,449 | 2023 |
| Harding County | 657 | 2025 |
| Hidalgo County | 4,178 | 2021 |
| Lincoln County | 20,269 | 2024 |
| Los Alamos County | 19,330 | 2023 |
| Luna County | 23,709 | 2021 |
| McKinley County | 71,780 | 2023 |
| Mora County | 4,189 | 2023 |
| Otero County | 67,839 | 2025 |
| Quay County | 8,746 | 2025 |
| Rio Arriba County | 40,179 | 2023 |
| Roosevelt County | 19,191 | 2025 |
| San Juan County | 123,958 | 2020 |
| San Miguel County | 27,150 | 2023 |
| Sandoval County | 146,749 | 2020 |
| Sante Fe County | 155,201 | 2023 |
| Sierra County | 11,576 | 2025 |
| Socorro County | 16,595 | 2025 |
| Taos County | 34,489 | 2025 |
| Torrance County | 15,045 | 2025 |
| Union County | 4,079 | 2025 |
| Valencia County | 77,190 | 2023 |
| Location | Population | Year |
|---|---|---|
| Buncombe County | 261,191 | 2020 |
| Chatham County | 79,864 | 2024 |
| Durham County | 326,126 | 2020 |
| Mecklenburg County | 1,000,000 | 2014 |
| New Hanover County | 243,333 | 2024 |
| Orange County | 152,877 | 2024 |
| Wake County | 1,112,000 | 2022 |
| Location | Population | Year |
|---|---|---|
| Cleveland (City) | 386,000 | 2017 |
| Franklin County | 1,321,000 | 2024 |
| Lucas County | 431,000 | 2015 |
| Stark County | 372,542 | 2014 |
| Youngstown (City) | 60,270 | 2022 |
| Location | Population | Year |
|---|---|---|
| Oklahoma County | 816,490 | 2025 |
| Location | Population | Year |
|---|---|---|
| Multnomah County | 803,377 | 2023 |
| Location | Population | Year |
|---|---|---|
| Allegheny County | 1,200,000 | 2016 |
| Montgomery County | 830,915 | 2021 |
| Location | Population | Year |
|---|---|---|
| Coddington County | 29,278 | 2026 |
| Minnehaha County | 189,000 | 2018 |
| Pennington County | 110,000 | 2018 |
| Location | Population | Year |
|---|---|---|
| Hamilton County | 367,804 | 2019 |
| Shelby County | 937,166 | 2019 |
| Location | Population | Year |
|---|---|---|
| Dallas County | 2,636,000 | 2020 |
| Harris County | 4,700,000 | 2017 |
| Tarrant County | 874,401 | 2021 |
| Williamson County | 590,551 | 2021 |
| Location | Population | Year |
|---|---|---|
| State of Utah | 3,100,000 | 2018 |
| Location | Population | Year |
|---|---|---|
| Augusta County | 78,064 | 2024 |
| Prince William County | 486,943 | 2024 |
| Richmond (City) | 229,395 | 2024 |
| Staunton (City) | 25,904 | 2024 |
| Waynesboro (City) | 22,808 | 2024 |
| Location | Population | Year |
|---|---|---|
| Clark County | 474,492 | 2019 |
| Pierce County | 925,708 | 2022 |
| Spokane County | 506,000 | 2019 |
| Thurston County | 297,977 | 2023 |
| Whatcom County | 229,247 | 2021 |
| Yakima County | 250,000 | 2016 |
| Location | Population | Year |
|---|---|---|
| Brown County | 264,542 | 2019 |
| Chippewa County | 64,658 | 2020 |
| Dane County | 536,000 | 2017 |
| Dunn County | 45,651 | 2023 |
| Eau Claire County | 104,646 | 2020 |
| La Crosse County | 118,016 | 2019 |
| Marathon County | 135,692 | 2021 |
| Milwaukee County | 952,000 | 2016 |
| Outagamie County | 186,000 | 2019 |
| Polk County | 45,709 | 2022 |
| Rock County | 163,354 | 2020 |
| St. Croix County | 95,044 | 2023 |
| Waukesha County | 404,198 | 2020 |
Learn how the PSA can enhance pretrial outcomes when implemented with fidelity.
The PSA factors and algorithm are publicly available here.
Discover what it takes to implement the PSA effectively and responsibly.
The guides provide all the information needed to implement the PSA.
Read the studies that evaluate and validate the PSA.